Leveraging Amazon S3 with Athena for Cost Effective Log Management
Authors: Matthew Hopkins (moebaca)
Efficient log management is essential in distributed systems for understanding system behavior and performance. Logs serve as a crucial tool for postmortem analysis, tracing, and monitoring. Today options like Amazon S3 with Athena exist to offer cost-effective, durable storage and serverless interactive SQL querying. This enables organizations to analyze vast amounts of log data with minimal overhead and costs compared to traditional log storage and analytics solutions.
In this blog post, we dive into our experience at Autify where we transitioned from a default Amazon CloudWatch Logs deployment to Amazon S3 with Athena for managing application logs. This architectural shift not only yielded immediate significant cost reductions as we scale alongside our customers, but also enhanced our capabilities for efficient analysis (our developers much prefer standard SQL to learning new DSLs).
In the second half of this post we will provide a practical code sample to guide you in an implementation that can be customized for your own log management and analysis requirements.
The Need for Optimization
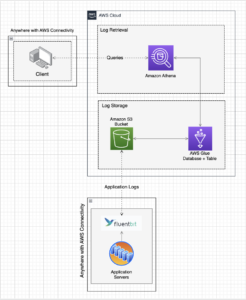
At Autify, we rely heavily on Kubernetes to orchestrate and manage our containerized applications. Like many organizations, we initially used SaaS solutions such as Datadog and CloudWatch Logs. While those tools are powerful and simple to adopt, the costs associated with ingesting logs became a rapidly growing concern as our workload scaled. As we continue to grow, so too does the volume of logs we are ingesting. CloudWatch Logs quickly became our second highest spend in AWS making it apparent that optimizing our log management was necessary. After much research we implemented the following simple solution:
Cost Optimization
Our migration from CloudWatch Logs to the above solution immediately resulted in substantial cost benefits. We have seen a reduction in costs for log ingestion, storage and querying saving thousands of dollars a month. Below are some examples that highlight the cost optimization potential achievable through this solution with example data.
Log Ingestion

Log ingestion is where our team at Autify was getting hit the hardest with regard to CloudWatch Logs fees. A big reason for this is that CloudWatch Logs applies compression AFTER ingestion by default. There are solutions to apply compression before, but not natively in the CloudWatch Logs Agent requiring a custom solution. This means you are ingesting a much higher amount of data vs. compressing first on the hosts before shipment. For our application logs using gzip level 6 compression on our worker nodes we receive an ~80% file size reduction. This alone is great, but the true champion of this solution is that shipping logs into S3 is entirely free!
🗣 All data transfer into S3 is $0.00 per GB [S3 Pricing]
Below is a hypothetical example of how ingestion fees can add up by using a reasonable 100GB/day of log ingestion spread over ~210,000 S3 objects as an example.
CloudWatch Logs:
- Data Ingestion Cost (100GB/day): $0.76/GB * 100GB = $76.00
- Total Daily Cost for Data Ingestion: $76.00
Amazon S3 (Standard Tier):
- Data Ingestion Cost (100GB/day): $0 (no charge for data transfer into S3)
- PUT Requests (209,716 number of objects x 0.0000047 USD) = $0.99
- Total Daily Cost for Data Ingestion: $0.99
Cost Savings per Day (Data Ingestion):
- S3 vs. CW Logs: $76.00 (CW Logs) – $0.99 (S3) = $75.01/day
Cost Savings per Month (Data Ingestion):
- $75.01 * 30.25 avg. days in a month = $2269.05/month
Storage
Storage in CloudWatch Logs begins to add up as you scale into the multi-Terabyte range and beyond. This is due to a fairly reasonable cost of $0.033/GB compared to the ever slightly cheaper $0.025/GB in S3 Standard. CloudWatch Logs also compresses logs once they are delivered into the service which is helpful. CloudWatch Logs Infrequent Access was also released recently, but doesn’t help with regard to the high ingest fees.
With that said, S3 provides much more flexibility with access to a variety of cheaper storage tiers as well as much more powerful lifecycle policies for log objects compared to CloudWatch Logs. It should be noted that CloudWatch Logs has the option to export logs to S3 if you should want to lifecycle logs to cheaper storage tiering, but at that point you’ve already paid for ingestion so cost savings won’t be achieved there.
In the example below we are going to assume a simple scenario storing 1000GB of data over a month to calculate raw storage costs:
CloudWatch Logs (Standard Tier):
- Storage Cost (100GB/month): $0.033/GB * 1000GB = $33.00
- Total Monthly Storage Cost: $33.30
Amazon S3 (Standard Tier):
- Storage Cost (100GB First Month): $0.025/GB * 1000GB = $25.00
- Total Monthly Storage Cost: $25.00
Cost Savings per Month (Storage):
- S3 vs. CW Logs: $33.30 (CW Logs) – $25.00 (S3) = $8.00/month
Queries
With optimal tuning of your S3 bucket, partitioning and object shipping, queries can be run for incredibly cheap with Athena!
In this example, we’ll compare the cost of running queries on the log objects stored in S3 with Athena vs. querying data stored in CW Logs using CloudWatch Logs Insights. Let’s assume the average query is 1GB of logs scanned and there are 1000 queries a day:
Athena pricing only has a small bullet point on the pricing page for API costs involved on the S3 bucket with regard to GET requests on the objects being called every time a query is run without Athena query result caching.
🗣 Always be vigilant in recognizing hidden fees that aren’t obvious upfront with AWS.
CloudWatch Logs:
- Query Cost (Logs Insights): $0.0076/GB of data scanned
- Assuming the same sample query that scans 1GB of data: $0.0076/GB * 1GB = $0.0076
- Total Monthly Query Cost: ($0.0076 * 1000 queries a day) * 30.25 average days a month = $229.90
Athena + S3:
- Query Cost: $0.005 per GB of data scanned
- Assuming a sample query that scans 1GB of data spread over 20,000 objects: (1GB * $0.005) * (20,000/1,000 * $0.0004 per 1,000 GET requests) = $0.005/query
- Total Monthly Query Cost: ($0.005 * 1000 queries a day) * 30.25 average days a month = $151.25
Cost Savings Per Month:
- Athena + S3 vs. CW Logs = $229.90 (CW Logs) – $151.25 (Athena) = $78.65/month
So, for each query that scans 1GB of data, you save $0.0026 by using Amazon Athena (S3) compared to CloudWatch Logs.
Summary
As demonstrated by this simple sample data, Log Ingestion is a significant component of the CloudWatch Logs bill. The example data used can effectively represent a medium-sized cloud workload, highlighting how fees can quickly accumulate with CloudWatch Logs. The advantage of the Amazon S3 and Athena log management approach is that as log ingestion increases, the savings provided by this solution also grow.
Log Ingestion Cost Savings per Month
- Percent Savings per Month: 99.96%
Storage Cost Savings per Month
- Percent Savings per Month: 24.02%
Queries Cost Savings Per Month
- Percent Savings Per Month: 34.26%
Performance Efficiency
With proper bucket partitioning in S3 and tuned log shipping with Fluentbit in place we also saw a slight increase in log querying performance with regard to execution time and data scanned when compared to identical CloudWatch Logs Insights usage. CloudWatch Logs Insights also limits output to 10,000 records maximum whereas Athena has no such limitation meaning we are receiving more records in less time with less overall data scanned.
Below is real log performance data showing identical Autify workload test run logs shipped to S3 vs. CloudWatch Logs. All application log streaming during this time period was mirrored to both S3 and CloudWatch Logs meaning both Athena and CloudWatch Logs Insights needed to sift through similar amounts of log data during query execution.
Time per Query
On average over 5 query runs Athena queries were faster on the benchmark test with an approximate average query runtime of 3.495 seconds compared to CloudWatch Logs Insights with an approximate average query runtime of 5.086 seconds.
CloudWatch Logs Insights: (5.6 + 5.6 + 6.4 + 5.4 + 5.4) seconds = 28.4 seconds / 5 queries = 5.68 seconds per query average
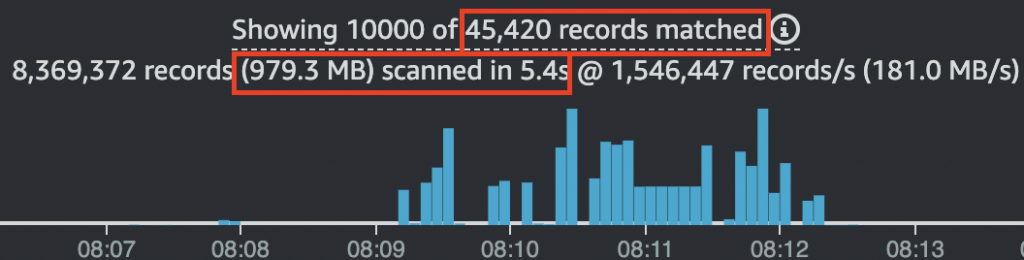
CloudWatch Logs runs longer and scans more data than the same test in S3 with Athena
S3 with Athena: (4.51 + 4.33 + 4.07 + 3.80 + 3.93) seconds = 20.7 seconds / 5 queries = 4.14 seconds per query average
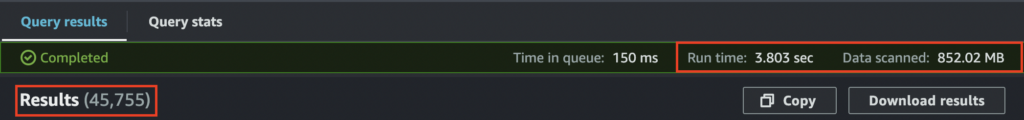
S3 with Athena scanning the same test data runs quicker and scans less data delivering more records
Totals: 5.68 seconds (CW Logs Insights) – 4.14 seconds (S3 with Athena) = 1.54 seconds
Data Scanned per Query
As seen in the benchmark data in the section above the same log data resulted in different amounts of log data requiring scanning depending on the service.
CloudWatch Logs Insights: 979.3MB scanned
S3 with Athena: 852.02MB scanned
Totals: 979.3MB (CW Logs Insights) – 852.02MB (S3 plus Athena) = 127.28MB less data scanned
As shown above, both the performance data for query time and data scanned were improved for the same test log data split between CloudWatch Logs and S3. With an average of 1.54 seconds and 127.28MB of data saved per query with Athena, this solution becomes even more attractive, regardless of the cost savings.
The most remarkable aspect is that as the time range of a test increases, this solution’s log querying performance scales dramatically better!
Caveats

While migrating from CloudWatch Logs to Amazon S3 with Athena can offer significant advantages in terms of cost optimization and performance efficiency, it’s important to note that this solution may not be a perfect fit for every workload. Below are some key caveats and considerations that organizations should keep in mind before implementing the solution.
- If realtime log streaming is required: This solution uploads log objects to S3 rather than streaming logs into a log group. Depending on your configuration, there may be a short latency of several minutes or more. In our implementation, we have set a maximum timeout of 3 minutes per log object meaning at most logs will take 3 minutes to become available. We also provide engineers with real-time access to logs on the pods they require for troubleshooting purposes if live streaming is required. This approach satisfies our use case, but it is an important point to consider for each unique environment.
- If frequently querying large time ranges for logs is required: Depending on the size of your workload and the number of running pods, you may have a large volume of log objects being uploaded to S3. Partitioning can help mitigate this issue by allowing you to easily filter down to a specific day and/or hourly scope, reducing the number of S3 objects that Athena needs to query. However, if you need to query data over a longer period, such as a month or more, consider the impact on S3 pricing. GET requests can accumulate costs, especially with a large number of accessed objects per query. Additionally, take into account the storage tier of your S3 objects, as GET requests may have varying costs depending on the object tiering. You can implement Athena Workgroup limits to mitigate any runaway queries.
- If you need anything more fancy than barebones log search: This solution is specifically designed for log analysis by modifying raw SQL queries. If you need something that automatically generates charts, graphs, or any other advanced features, then this solution may not be the best fit for you. If you just need basic log searching functionality and are looking to do it for dirt cheap irrespective of log ingest volume then look no further!
Example Implementation
The below implementation is a barebones example of how to kickstart this solution in your own environment using Terraform for IaC and Fluent Bit for application log shipping to S3.
Note – This solution is not Kubernetes dependent. It can be modified for use with any platform.
Step 1: S3, Glue and Athena Environment Preparation
Before you can begin shipping logs, you’ll need to set up an S3 bucket in the region you intend to ship logs from (to save on inter-region data transfer costs). Additionally, you’ll need to create a Glue database and table for Athena to query.
Below is an example Terraform implementation that performs the following tasks:
- Creates an S3 bucket for log storage.
- Creates an S3 bucket for Athena query results.
- Sets up a Glue database.
- Configures a Glue table for Athena to access log data with partitions on Year, Month, Day and Hour.
- Creates an Athena workgroup for log query output.
locals {
  bucket_name = "log-storage-bucket"
  glue_name   = "app_logs"
}

# Create an S3 bucket for log storage
resource "aws_s3_bucket" "bucket" {
  bucket = local.bucket_name
}

# Create an S3 bucket for Athena query results
resource "aws_s3_bucket" "athena_results_bucket" {
  bucket = "${local.bucket_name}-query-results"
}

# Create a Glue database
resource "aws_glue_catalog_database" "app_logs_db" {
  name = "${local.glue_name}_db"
}

# Configure a Glue table for Athena to access log data
resource "aws_glue_catalog_table" "app_logs" {
  name          = "${local.glue_name}_table"
  database_name = aws_glue_catalog_database.app_logs_db.name
  table_type    = "EXTERNAL_TABLE"

  parameters = {
    EXTERNAL                        = "TRUE",
    "projection.enabled"            = "true",
    "projection.namespace.type"     = "injected",
    "projection.date.interval"      = "1",
    "projection.date.interval.unit" = "DAYS",
    "projection.date.type"          = "date",
    "projection.date.range"         = "2023/09/01,NOW",
    "projection.date.format"        = "yyyy/MM/dd",
    "projection.hour.type"          = "enum",
    "projection.hour.values"        = "00,01,02,03,04,05,06,07,08,09,10,11,12,13,14,15,16,17,18,19,20,21,22,23",
    "storage.location.template"     = "s3://${aws_s3_bucket.bucket.id}/$${namespace}/$${date}/$${hour}",
    "read_restored_glacier_objects" = "true"
  }

  storage_descriptor {
    location      = "s3://${aws_s3_bucket.bucket.id}/"
    input_format  = "org.apache.hadoop.mapred.TextInputFormat"
    output_format = "org.apache.hadoop.hive.ql.io.HiveIgnoreKeyTextOutputFormat"

    ser_de_info {
      serialization_library = "org.openx.data.jsonserde.JsonSerDe"
      parameters = {
        "ignore.malformed.json" = "FALSE",
        "mapping.timestamp"     = "time",
        "mapping.podname"       = "podname",
        "mapping.containername" = "containername"
        "mapping.stream"        = "stream",
        "mapping._p"            = "_p",
        "mapping.log"           = "log"
      }
    }

    columns {
      name    = "timestamp"
      type    = "string"
      comment = "Timestamp as reported in the log string, non-partitioned. Mapped to data field in JSON."
    }

    columns {
      name = "podname"
      type = "string"
    }

    columns {
      name = "containername"
      type = "string"
    }

    columns {
      name = "stream"
      type = "string"
    }

    columns {
      name = "_p"
      type = "string"
    }

    columns {
      name = "log"
      type = "string"
    }

    sort_columns {
      column     = "timestamp"
      sort_order = 0
    }
  }

  partition_keys {
    name = "namespace"
    type = "string"
  }

  partition_keys {
    name    = "date"
    type    = "string"
    comment = "Date inferred from the log file location, partitioned"
  }

  partition_keys {
    name = "hour"
    type = "string"
  }
}

# Create an Athena workgroup for query execution
resource "aws_athena_workgroup" "workgroup" {
  name = "${local.glue_name}_wg"

  configuration {
    enforce_workgroup_configuration    = true
    publish_cloudwatch_metrics_enabled = true
    result_configuration {
      output_location = "s3://${aws_s3_bucket.athena_results_bucket.bucket}/output/"
    }
  }
}
Step 2: Deploying the Log Shipping Configuration
For this implementation we will rely on Fluent Bit, an open-source log processor and forwarder with the Amazon S3 output plugin. Fluent Bit allows us to collect logs from various sources, unify them, and send them to multiple destinations.
Here we will configure Fluent Bit to filter log records down to our specific application containers, enrich each log entry with their respective pod and container names and finally ship the log objects to Amazon S3.
- Deploy Fluent Bit as a DaemonSet: Deploy Fluent Bit to ensure that it runs on each of your nodes that require log shipping. We use the AWS for Fluent Bit image, but you can choose any version that supports the S3 output plugin.
- IAM Permissions: Ensure that the IAM role attached to your worker nodes has the necessary permissions to upload log objects to the S3 bucket. Use the following policy as an example:
{ "Version": "2012-10-17", "Statement": [ { "Action": [ "s3:PutObject", ], "Resource": [ "arn:aws:s3:::${log_bucket_name}", "arn:aws:s3:::${log_bucket_name}/*" ], "Effect": "Allow" } ] } - Update
fluent-bit.confConfiguration: Update yourfluent-bit.confconfiguration as follows:- Modify values within
< >to match your specific application. - Adjust the Lua filter in the [FILTER] section to retrieve container and pod names based on your workload’s naming convention (the provided Regex may not work perfectly for your pods/containers).
- Tweak the
total_file_sizeandupload_timeoutvalues based on your engineering needs. These values determine how quickly objects are delivered to S3.
# Configuration for Fluent Bit service - modify to your specific env [SERVICE] Flush 5 Log_Level info Daemon off Parsers_File parsers.conf HTTP_Server On HTTP_Listen 0.0.0.0 HTTP_Port 2020 storage.path /var/fluent-bit/state/flb-storage/ storage.sync normal storage.checksum off storage.backlog.mem_limit 5M # Configuration for input data source using tail plugin [INPUT] Name tail Tag application.* Path /var/log/containers/<your application>.log Parser crio multiline.parser docker, cri DB /var/fluent-bit/state/flb_<your application>.db Mem_Buf_Limit 100MB Skip_Long_Lines On Refresh_Interval 5 Rotate_Wait 30 storage.type filesystem Read_from_Head ${READ_FROM_HEAD} # Configuration for container and pod name enrichment using Lua script [FILTER] Name Lua Match <your application>.* call modify_record code function modify_record(tag, timestamp, record) record["podname"] = string.match(tag, "<your application>%.var%.log%.containers%.(.-)_(.-)_.*%.log$") record["containername"] = string.match(tag, "_([^_]+)-%w+%.log$") return 1, timestamp, record end # Configuration for output, shipping log objects to S3 [OUTPUT] Name s3 Match selenium-pvt.* bucket log-storage-bucket region ${AWS_REGION} total_file_size 100M upload_timeout 3m compression gzip s3_key_format /<your application>/%Y/%m/%d/%H/$TAG/$UUID.json.gz s3_key_format_tag_delimiters .- json_date_key false retry_limit 999 # Configuration for CRIO Parser [PARSER] Name crio Format Regex Regex ^[^ ]+ (?<log>.*)$ Time_Key time Time_Format %Y-%m-%dT%H:%M:%S.%L%z - Modify values within
- Verify Log Delivery: Ensure that logs are being delivered to your destination S3 bucket. It may take some time for the first object to appear, depending on the values you configured earlier.If logs aren’t appearing in your S3 bucket, please follow these troubleshooting steps:
- Double-check IAM Permissions to ensure write access to the destination bucket on your worker nodes.
- Review Fluent Bit Pod Logs to check for configuration errors.
Step 3: Querying Logs Using Athena
Now that we have all the infrastructure in place and log objects are successfully shipping to S3, it’s time to start querying the logs.
To begin, access the Athena console and go to the Query Editor. In the top right corner of the editor, select your Workgroup that was created in the terraform apply. Finally, input the following query updating the value in <your application> for your application name:
SELECT timestamp, log, containername, podname
FROM "app_logs_db"."app_logs_table"
WHERE namespace = '<your application>'
  /* AND podname = 'example-pod' */
  /* AND containername = 'example-container' */
  /* AND log LIKE '%example log text%' */
  /* AND date >= '2023/09/01' */
  /* AND date <= '2023/09/02' */
  /* AND hour = '01' */
ORDER BY timestamp DESC
LIMIT 10
You can modify this query template to suit your requirements. By default, it allows you to search for logs in a specific pod or container based on any log message, date, and hour. Using the date and hour conditions significantly narrows down the query range via partitioning, resulting in time and cost savings as the bucket scales with your workloads!
🗣 If you receive an error, please follow these troubleshooting steps:
- Ensure the database exists and that you are in the correct region.
- Ensure the table exists.
- Ensure you have proper IAM Permissions to query the data.
Summary
Based on your workloads requirements and given the provided caveats, migrating to Amazon S3 with Athena can potentially offer your organization cost optimization, improved performance efficiency, and scalability for managing cloud application logs compared to other managed log storage and analytics solutions such as CloudWatch Logs or Datadog Logs.