
.svg)

Modern apps are visual. Almost everything has a UI. That means you need a way to test how it actually works in the browser, from start to finish. Playwright helps with that. It makes it easy to write fast, reliable end-to-end tests across browsers like Chromium, Firefox, and WebKit.
Most of the time, it works well. But when something breaks and you can’t tell why, it gets frustrating fast. One test fails. The browser shuts down. All you’re left with is an error message that doesn’t say much. That’s where debugging matters.
In this guide, we’ll walk through how to debug Playwright tests, the common issues you might hit, and the tools and tips that make troubleshooting easier.
What Is Playwright Debugging?
When browser automation fails, it rarely does so politely. Sometimes, the selector misses. Sometimes, the page hasn't finished rendering. Playwright debugging is the process of identifying and resolving issues that cause your end-to-end tests to fail, by examining what the browser did, how your code interacted with it, and what state the application was in when things broke. Whether a test fails due to a missing element, a timing problem, or incorrect application behavior, debugging helps you understand why the failure happened and how to fix it.
To enable you to do this well, Playwright gives you tools designed not just for writing tests, but also for investigating them. Let’s take a look at some of these tools:
- The first and most immediate of these is the Playwright Inspector, which is a visual tool that shows you exactly what each step in your test is doing. You can pause execution, explore the DOM, and confirm that selectors are matching the right elements.
- But debugging doesn’t always happen live. Often, you’re looking into failures that occurred during a CI run, in a headless browser, without visual context. That’s where trace recording comes into play.. The software fully records all browser actions, with screenshots, DNA, network records, and logs, letting you inspect them later. The software transforms these moments into easily explorable timelines.
- In cases where timing is unclear, say, a modal appears too slowly, or a page transitions before an element is ready, you can pause execution deliberately. Breakpoints provide opportunities to pause execution at important stages. The pause() command stops the automation so developers can inspect the application at that very moment with the browser’s built-in tools.
- Playwright also lets you look deeper into how it makes decisions. A verbose log reveals what selectors it resolves, what elements it targets, what it waits for, and why it retries certain actions. These insights help diagnose invisible issues like misfired events or misaligned waits.
- And when the issue is likely a flaky or unstable selector, you can visually confirm what the test sees by calling .highlight() on any locator. The corresponding element will light up in the browser, confirming whether your selector is accurate or way off.
- Finally, many bugs don’t show up in the UI at all. That’s why Playwright allows you to monitor console output from the app under test, catching JavaScript warnings, errors, and logs that might otherwise go unnoticed.
In short, Playwright debugging isn’t about adding wait times and hoping for the best. It’s about observing the system clearly, testing hypotheses in real time, and using the full suite of browser tooling to solve the puzzle efficiently.
A good first action is to enable debugging when you run your tests.
How to Debug Using Playwright
You write a test. It fails. You re-run it. It passes. Then fails again. At some point, you stop blaming your app and start questioning your tooling. But here’s the thing, Playwright doesn’t just automate browsers. It gives you real-time, hands-on ways to debug your test flows. If you’re only rerunning failed specs and scanning logs, you’re not using half of what it can do.
Using Breakpoints for Effective Debugging
Let’s get one thing out of the way. Playwright isn’t magic. It waits intelligently for elements, but apps are messy. Modals delay. Selectors change. Event timing shifts. The difference between hours of guessing and two minutes of clarity often comes down to this: Did you actually stop and look?
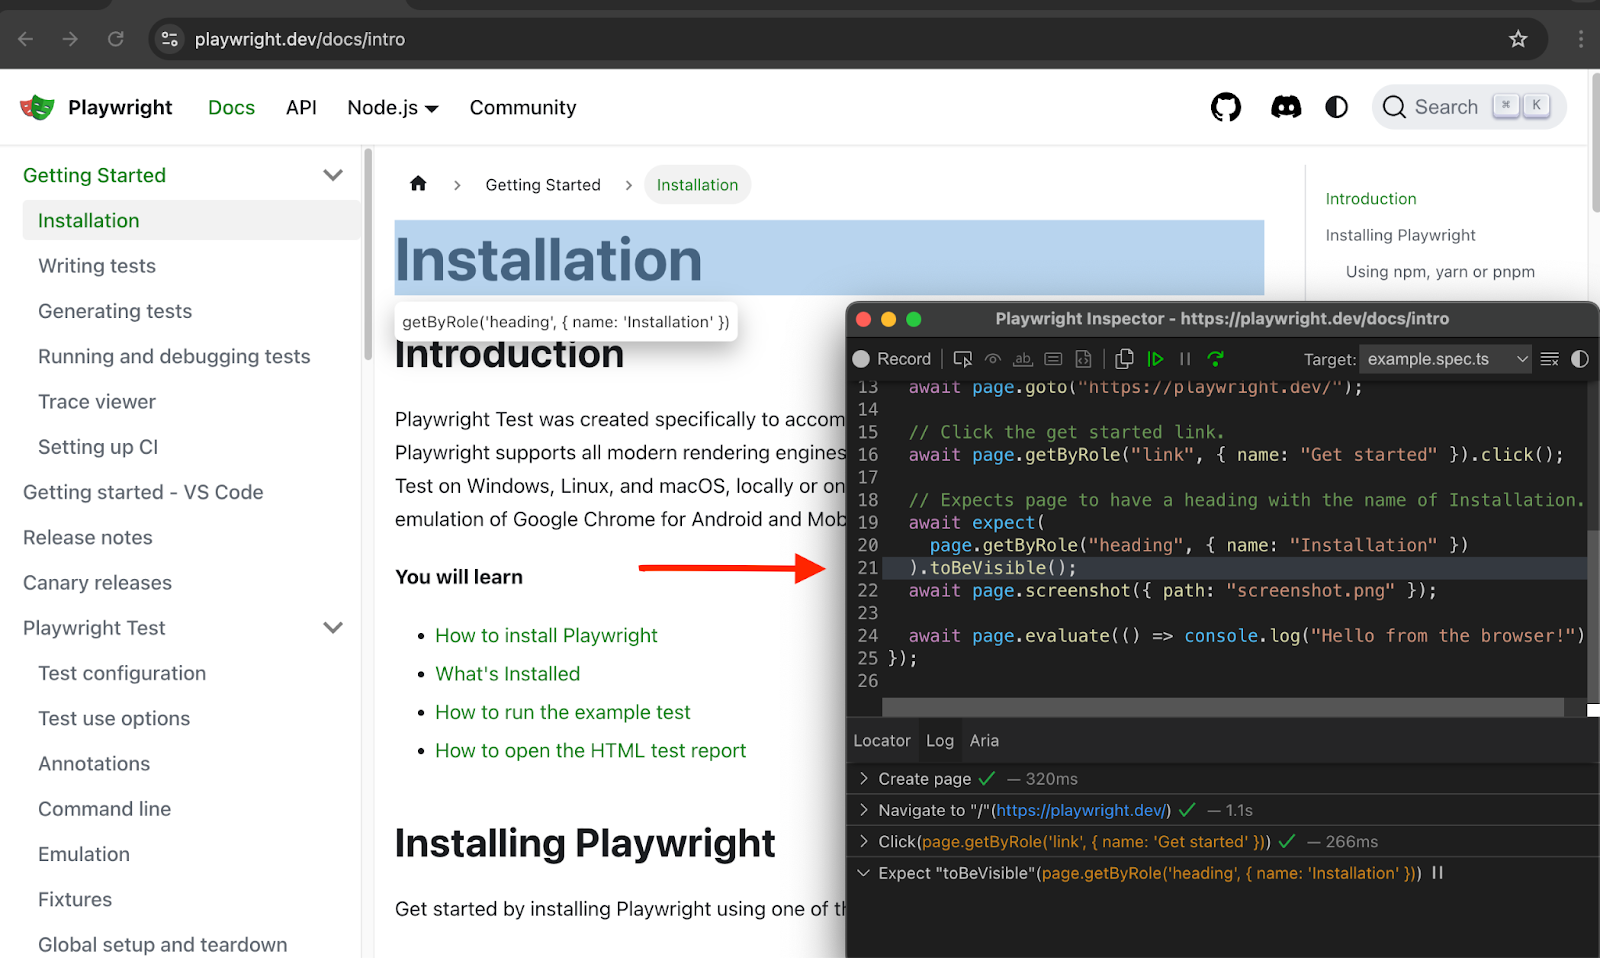
- The best way to do that is with the Playwright Inspector. Run your test with the debug flag:
npx playwright test --debugThat’s it. You get a headed browser and a control panel. Execution pauses before the first step. You can step through, explore the DOM, click around, and even retry selectors in real time. This isn’t just a test viewer. It’s a dev console for your UI tests. Instead of rerunning a test 20 times with different waitFor hacks, you get to see exactly what’s happening, when it happens.
- During development, headless mode is like flying blind. You want to see what your test sees. You want animations, focus states, transitions - everything the user experiences. A tip is to add this to your config:
test.use({ headless: false });
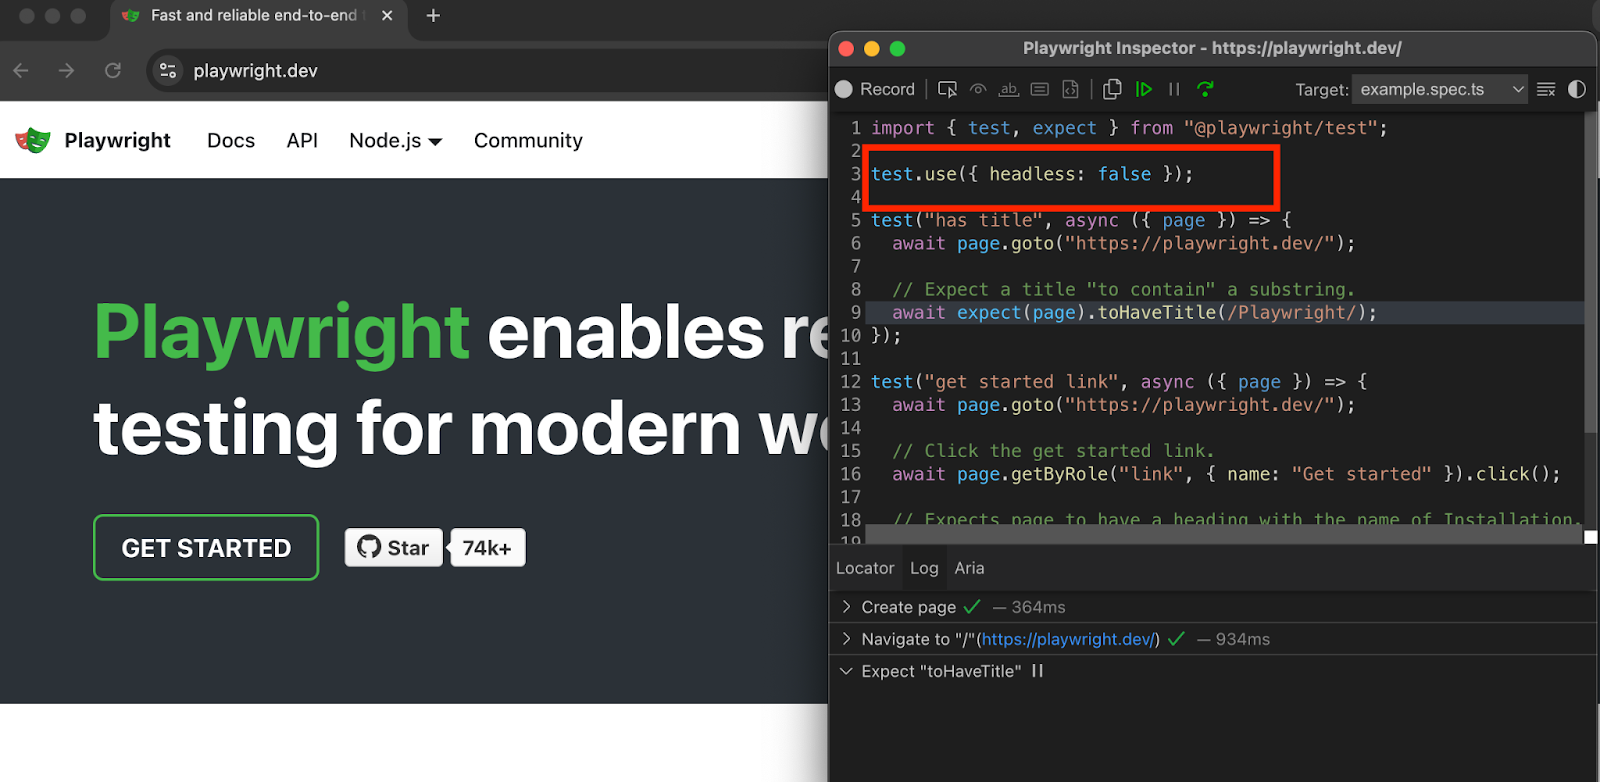
Now every local run shows the full browser. This makes layout bugs obvious. It also saves time when you’re debugging UI transitions, CSS glitches, or event timing.
- But sometimes, you don’t want to inspect the entire test, just a specific moment. That’s where manual pauses come in. You can drop a debugger statement or use page.pause() at any point in your test code to stop execution and enter the Inspector.
test('debugging login flow', async ({ page }) => { await page.goto('/login'); await page.fill('input[name="email"]', 'user@example.com'); await page.pause(); // Pause here and inspect manually await page.click('text=Submit');});This lets you freeze the test precisely when the DOM changes, when a modal appears, or when something doesn’t behave as expected. You can explore the page state, test selectors, and run expressions in dev tools before continuing.
The real advantage isn’t just visibility, but control: instead of rerunning the test and guessing, you pause it mid-run, inspect exactly what’s happening, and move forward with clarity.
Console Logging Techniques in Playwright
Not every broken state in a browser test causes a failure. Sometimes the problem is upstream. A component silently fails to mount. A network request 404s without throwing an error. Or a runtime exception shows up in the console but doesn’t break the flow. Your test passes, technically, but something’s wrong.
That’s where debugging with visibility matters. Playwright gives you access to what’s happening inside the browser, beyond your test assertions. It’s not just about whether the button was clicked. It’s about what the browser saw, logged, and rendered along the way.
- The first place to look is the browser console. If a React component throws an error or your frontend logs a warning, you need to see it. Playwright lets you tap into these messages directly:
page.on('console', msg => console.log(msg.text()));This gives you everything the browser console sees, console.log(), console.warn(), console.error(), and even console.debug() calls. If your app relies on logs for sanity checks or debugging, you get full access during the test run. You don’t have to guess what the app was doing. The logs tell you.
- There are times when nothing is visibly broken, but something important didn’t render. Maybe a dynamic list is empty. Maybe a modal never appeared. If the test didn’t fail, it might be because your assertion never triggered. You can capture the entire HTML content of the current page with:
console.log(await page.content());It dumps the full DOM structure as a string. That’s useful when you need to verify that a component was rendered, or to spot when a critical chunk of the page didn’t load. It works like a viewing source in the browser, but programmatically during the test.
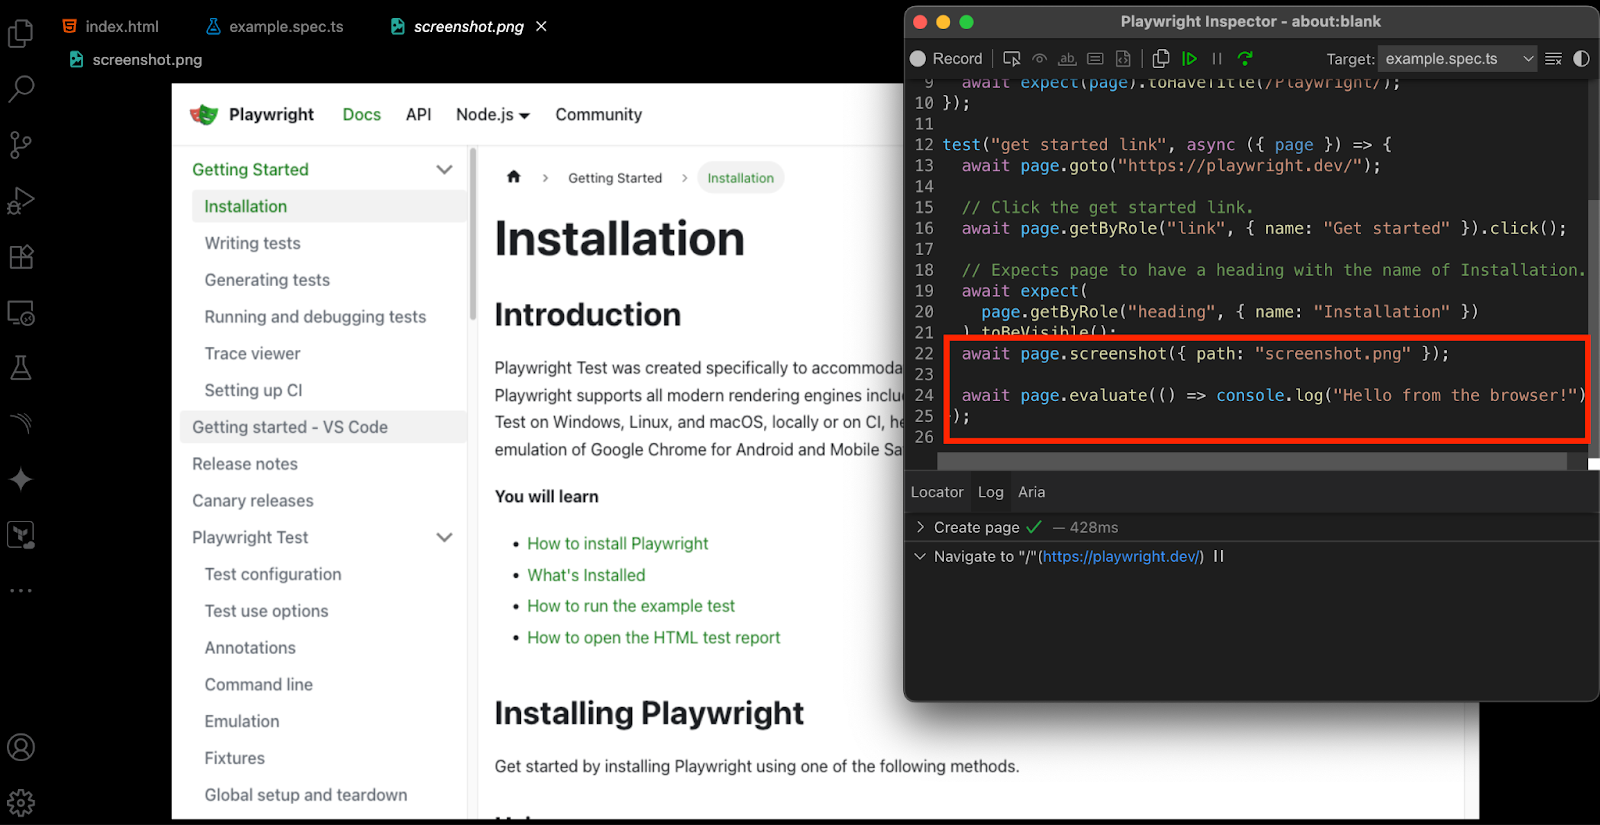
- Sometimes, the log is clean and the HTML looks fine, but visually the page is broken. A dialogue is off-screen. A button is hidden behind another element. A styling bug pushes content below the fold. In these cases, a screenshot is faster than any log or assertion:
await page.screenshot({ path: 'debug-state.png' });You get a snapshot of the app exactly as Playwright saw it during the test. This is especially helpful in CI environments where you can’t see the browser live. Store the image. Check it later. Or attach it to your test report if you’re running in a test suite.
- When you’re chasing down flaky selectors or trying to understand why a click isn’t working, guessing isn’t good enough. You need to see what the test is interacting with. That’s where highlight() comes in. Playwright lets you visually light up any locator in the browser window:
await page.locator('text=Submit').highlight();The element you’ve selected will glow briefly in the Playwright Inspector. That’s your confirmation that the selector is pointing to the right thing, not a hidden element, not an off-screen duplicate, not something broken in the DOM.
Handling Asynchronous Code During Debugging
It’s common for Playwright tests to fail because of discrepancies related to asynchronous operations. Stick to making assertions with expect() and don’t use artificial calls like waitForTimeout. Always use await inside async calls to prevent having race conditions. Clear your selections after any navigation or when the web page changes.
Best Practices for Writing Debuggable Playwright Tests
Here are some best practices to follow:
- Turn on trace: ‘on-first-retry’ to see the reasons behind failed tests in the trace viewer included with Playwright.
- Adjust the screenshot setting to take screenshots only when tests fail automatically, and adjust the video setting to keep video artifacts anytime a test fails.
- Begin defining requirements as exact custom messages to make each error understandable and solvable.
- Open the Playwright Inspector in slow motion and with all UI visible to examine both timing and selector concerns.
- During debugging, only focus on one test at a time so unrelated issues are not added.
- Never make a test longer than it needs to be. Smaller tests are associated with easier testing and debugging. Finding the cause of a failure is difficult when the tests are lengthy and complex.
- Clear the browser's temporary data to avoid accidentally keeping information about your application's internal state.
Troubleshooting Common Playwright Errors
Below is a list of common errors and how to troubleshoot them.
TimeoutError
This error usually means Playwright was waiting for an element that didn’t show up in time. It might be because the page loaded slowly, the selector was wrong, or the element never appeared at all. To fix it, make sure your selector is correct and stable. Using data-testid helps. You can also wait for the page to load with waitForLoadState(), or use await expect(locator).toBeVisible() to wait until the element is ready.
Element Is Not Attached to the DOM
Because the DOM node was removed before the action, you can’t interact with it anymore. This often happens in React projects, as React frameworks refresh elements to update content. Don’t put locators into variables and reuse them after an asynchronous action; fetch them again right before interacting with the element.
Navigation Timeout Exceeded
A page that takes a long time to load will lead to a Playwright thrown error. Certainly, this may occur because of slow communication between the server and the browser, lengthy network requests, or issues with redirecting loops. Adjust the timeout if required or set waitUntil to either ‘domcontentloaded’ or ‘networkidle’ to have your app load, as you prefer. Make sure to find out what’s happening within the application to assess if increased delays or issues are coming from there.
A page that takes a long time to load will lead to a Playwright thrown error.
Click Intercepted or Invisible Element
This error appears when Playwright tries to click a hidden, hidden-by-another, or out-of-sight element. Most of the time, it shows that either the timing is off, a modal popup covers the page, or a CSS animation has not finished. To address this, check that the element is present and clickable by using expect(locator).toBeVisible() before attempting the tap. Should you need to, scroll the item into view or, as a final fallback, set force: true in the click() function, but only if you know what you’re doing.
Tests Fail in CI
Developers often find that tests pass on their system but fail when tested in a continuous integration system. Usually, headless browser mode, outdated hardware, or missing fonts cause the problems. These issues locally can be tested using --headless or slowMo: 100 options, which mimic how tests run in CI. Add npx playwright install --with-deps to your CI configuration to install all dependencies.
Errors Related to Opening Browsers or Applications
A failed browser and a "protocol error" generally indicate that a library is missing or the browser binary is damaged, mainly for Linux CI environments. Resolving this issue requires installing Playwright and dependencies using npx playwright install --with-deps. If using Docker, opt for the official Playwright Docker image because it’s ready to use and preinstalls everything you need for headless browsers.
Why Playwright Debugging Is Important
Debugging with Playwright is very important for tests that are both stable and quick to execute. Thanks to tools such as page.pause(), trace viewer, and debugging in headed mode, you can better monitor each step in your tests. Logging errors, using focused assertion checks, and separating your tests with neat barriers allow you to spot and fix problems before they affect your users. Learning to debug well saves time, makes your tests more reliable, and builds confidence in what you’re doing.


